I’ve had the Dexcom for about 2 months now, I think it’s 50 days to be exact, but, who’s counting. I am a huge fan of data. I like data, but sometimes too much data can just complicate things. That’s one reason that I love Dexcom CLARITY®.
I can get a very quick snapshot with a visualization of my time-in-range and average glucose over the reporting period and then move on with my day. Or, if I wanted to, I can dig deep into patterns and issue areas.
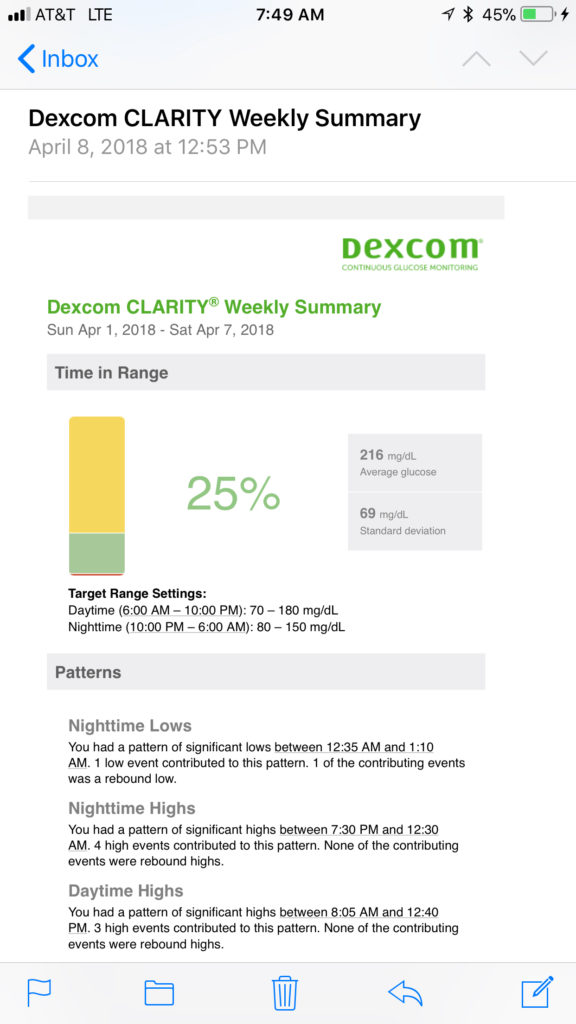
I get a weekly email with my previous 7 days data and my time in range. I don’t even need to click through to anything, the email just appears.
I’ve been using the Dexcom CLARITY® iPhone app to view all of my data. But, for the big 50 days of data and for today’s post, I figured I would actually look at it on the regular website.
So, let’s take a look.
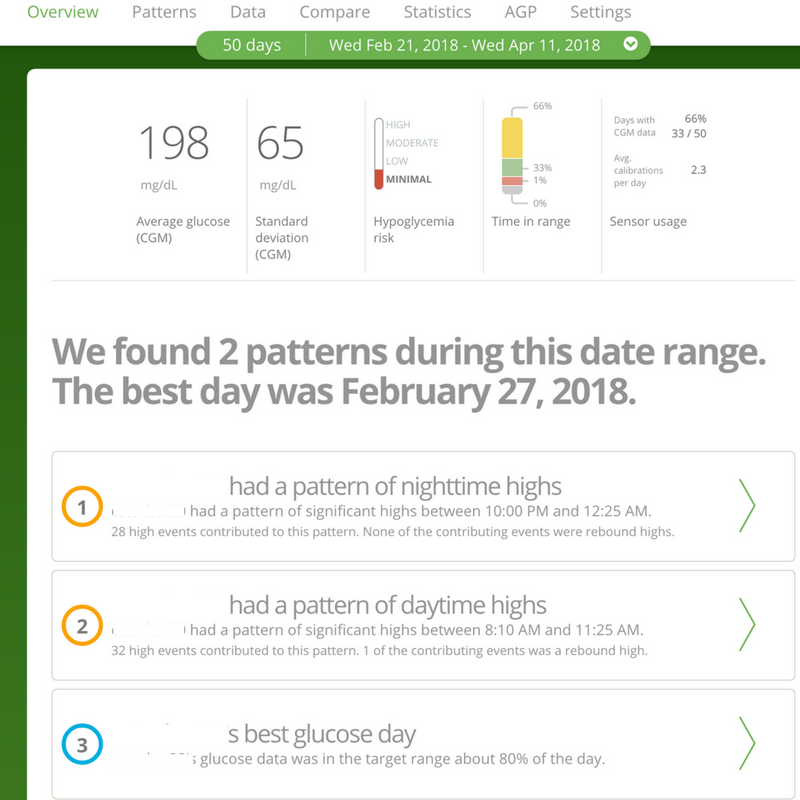
Here is an overview of the last 50 days. As you can see it includes:
- Average Glucose (from the CGM)
- Standard Deviation
- Hypoglycemia risk
- Time in range
- Sensor Usage
- Patterns
Time in Range
When I look at this overview page, the first thing that I look at is the Time in Range. As you can see, I only spent 33% of the time in range. With 66% of that time being high. That just goes to show that it’s so much harder to bring down a high than it is to bring up a low.
I am not happy with the 33%. It is a pretty number because it is exactly 1/3 of the time has been spent in range. Unfortunately, that’s not where I would like it to be. My goal is to spend at least 50% of my time in range. Once I hit that goal, then the next goal is to reach 66%, then 75%. I know that I won’t reach 100% time in range, but if I can stay above 75% consistently, I will consider that a win.
Now, I did tighten up my ranges during this period as well. I moved my “high” range down from 250 to 170. So, any number above 170 is considered out of range.
Average Glucose
The next number that I look at is the Average glucose. As you can see above, it was 198. That also is not where my goal is, but it is better than the previous 90 days. My last A1C taken in February was 8.2. My goal was to be below 7.5 by the time the next one came. 198 is about a 7.7 A1C level I believe? Not at my goal, but with all of the exercising that I have been doing combined with me facing my eating problems, I feel like I can definitely bring that down quickly.
Standard Deviation
Standard Deviation is not something that I really look at, mainly for two reasons.
- Standard deviation problems in college always were hard for me and it confused me, so I just don’t pay attention to it. My understanding is…the higher it is, the worse it is. But, I don’t know if 65 is good or not? Someone out there reading this, can you help?
- I don’t know what to compare this to. I can track this over the months and see if it comes down and then I’ll know if 65 is good or not.
Days with CGM Data
The next piece that I look at is the days with CGM data. As you can see for the last 50 days, it was only 33 out of 50 days, so 66% of the time. I took my 24 hours of being naked time and then took about another week off. How I missed 17 total days…that I don’t know. I’d obviously like that to be much higher. That one I can easily control.
Patterns Found
The last thing that I look at in this overview page is the patterns that were found by Dexcom. As you can see above, there were 2 patterns.
- A pattern of nighttime highs
- A pattern of daytime highs
That sounds like 2/3 of my day, just like the time in range report stated.
I have a problem with morning highs. My blood sugar just spikes as soon as I wake up, whether I eat anything or not. The nighttime highs are primarily due to the fact that if my blood sugar is about 200 or so during the night, I usually don’t wake up to take a shot. Once again, that is something that I can work on myself.
My Best Day
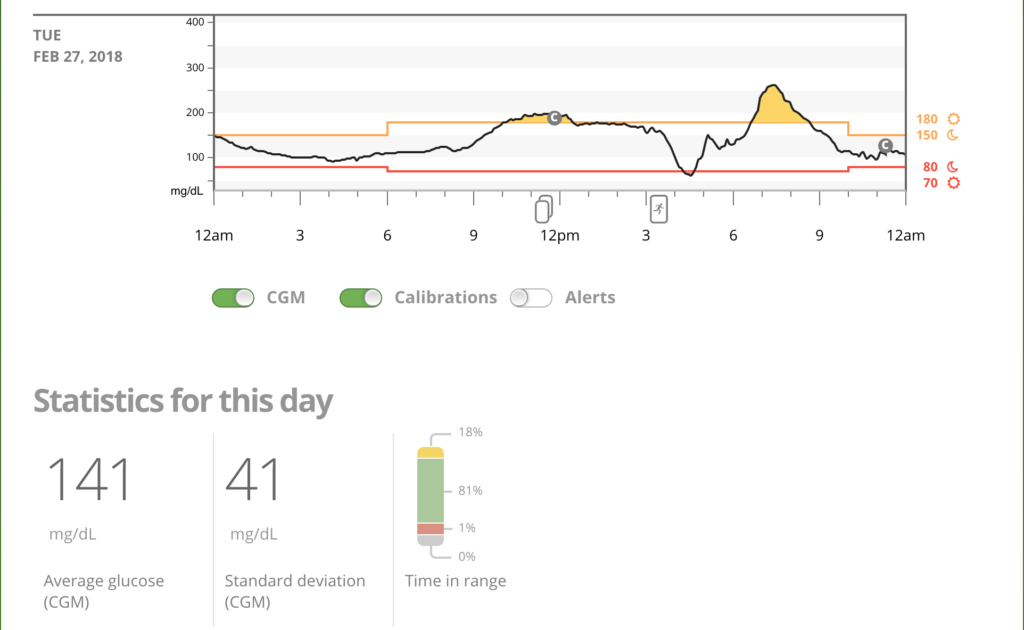
The final thing listed in this overview report is a link to my best day, which says I spent 80% of the day in range. I wish I knew more about that day and what I ate and what I did so that I can mimic that day.
Here’s a snapshot of that day:
So, that’s it. That’s the overview of the first 50 days of data with Dexcom.
These quick overview reports give me everything that I need to know in order to make changes. If I want to dig deeper (which I will), I can look at exactly what time of day am I most out of range vs in range and figure out what I’m doing at those times.
I will use everything that I learned from Bright Spots and Landmines.
Chris, I have always found that the A1C is higher using the software from either the Medtronic or Dexcom application. In my case it is about 0.2 points on either software. So you may be closer to your goal then you recognize.